


The 2025 WCDS is March 4 - 7 in Red Deer AB
Join us at the Red Deer Resort & Casino on March 4 to 7, 2025 for the 42nd annual Western Canadian Dairy Seminar. Over three and half days you will hear about current research and new technology and engage with industry leaders to discuss emerging challenges facing the industry.
With two receptions, a banquet, and ample networking opportunities in the 79 booth trade show area, WCDS is the place to reconnect with friends and colleagues and make new connections. Whether you are a dairy producer, veterinarian, dairy extension specialist, dairy service and supply representative or a budding agricultural student, WCDS has something to offer you.
Stay tuned for more details on the 2025 WCDS!
Award of Merit
Know someone who has made a superior contribution in the areas of education, training, technology transfer or extension to the Western Canadian dairy industry? Nominate an individual for the John J. Kennelly WCDS Award of Merit.
WCDS In The News
McConnell, Finstad on 'The Dynamic World of Agri-Food' - Progressive Dairy Canada, April 2023
Transition Cow Management and its Role in Reproductive Success - BC Holsten News, April 2023 (page 42)
Minimizing Stress to Enhance Cow Health and Productivity - BC Holsten News, April 2023 (page 43)
Western Canadian Dairy Seminar goes virtual on March 8-12 - Progressive Dairy Canada, March 2021
5 habits of highly effective dairy farmers - Progressive Dairy-Canada, June 2020
Three dairies offer alternative approaches to biosecurity - Progressive Dairy-Canada, June 2020
Research to inform cattle transportation regulations - Progressive Dairy-Canada, April 30, 2020
Technologies, food trends to impact agriculture beyond 2020 - Progressive Dairy-Canada, April 17, 2020
Missed out on the 2024 Virtual Farm Tours?
Click here to view the 2024 tours of 3 dairies who demonstrate Sustainability & Resilience, as well as past WCDS virtual tours
Thank you to speakers, sponsors, attendees and organizers for another wonderful year!
Click here to view the 2024 sponsors
Weren't able to attend the 2024 WCDS? The proceedings will be posted soon!
Follow us to stay up-to-date on everything WCDS!
![]()
![]()
![]()
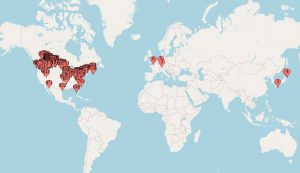
Delegates travel from far and wide
Thank you to all past WCDS sponsors for making our event possible!